 three-kit


@zkmake/three-meter
Frame metrics for a three.js renderer, with a small dockable HUD: FPS, CPU and GPU time, stutter
(1% low, p99 frame time, hitches), draw calls, render passes, triangles, and the geometries,
textures and shaders in GPU memory. Zero dependencies. Works with WebGLRenderer and
WebGPURenderer, with or without React.
bun add -d @zkmake/three-meter # or npm i -D / pnpm add -DLive demo: three-kit.pages.dev/three-meter, with a vanilla three and a
React Three Fiber take on the same scene. Add ?webgpu for the WebGPU renderer and ?count=30000 to
load the scene up past the demo’s triangle budget.
| Expanded | Collapsed | |
|---|---|---|
| Dark |
|
|
| Light |
|
|
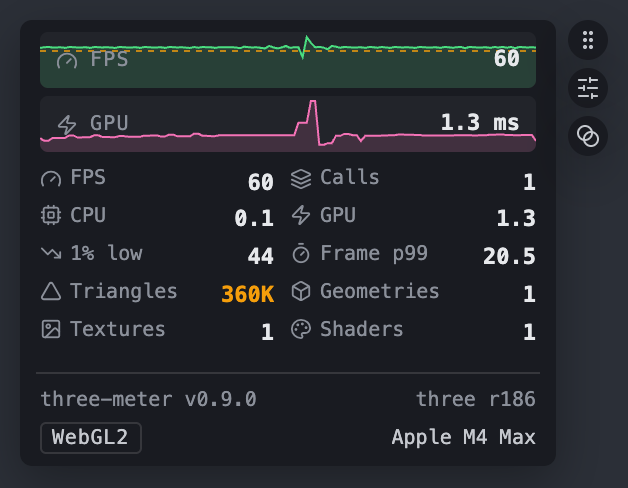
- Spot problems at a glance. Values past their budget turn amber, and every metric explains itself on hover, so you don’t need to know what a p99 is to see that one is bad.
- See stutter, not just averages. 1% low, p99 frame time and hitch counts catch the frame that drops every few seconds while the FPS average still reads 60.
- Real GPU time from timer queries on WebGPU, and on WebGL in Chrome and Edge, not an estimate from frame intervals.
- Find what’s expensive. A breakdown of draw calls and triangles by mesh and material shows which objects to instance or merge.
- One-click bug reports. Copy versions, backend, GPU and the current numbers as Markdown.
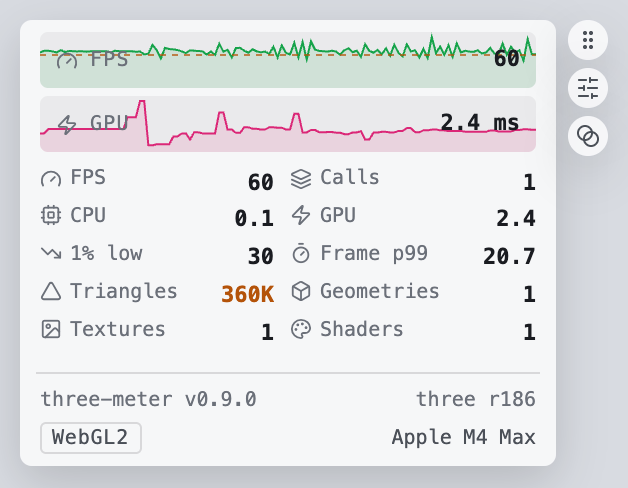
- Stays out of the way. The sampler and the card are separate components, so toggling the HUD never remounts your canvas. The card docks to a screen edge, remembers where you put it, and hides its controls until the pointer comes near; a third disc there dims it when the pointer leaves.
Entry points
| Import | What it is |
|---|---|
@zkmake/three-meter |
PerformanceMonitor. begin() and end() bracket a frame. No DOM. |
@zkmake/three-meter/ui |
mountPerfHud(monitor, options), the dockable card. Vanilla DOM. |
@zkmake/three-meter/react |
PerfSampler inside <Canvas>, PerfHud outside it. Peers: react and r3f. |
Vanilla three
import { PerformanceMonitor, wrapAnimationLoop } from "@zkmake/three-meter";
import { mountPerfHud } from "@zkmake/three-meter/ui";

const monitor = new PerformanceMonitor({ renderer });
const hud = mountPerfHud(monitor); // appends to document.body, docks left-centre

renderer.setAnimationLoop(
  wrapAnimationLoop(monitor, () => {
    update();
    renderer.render(scene, camera);
  }),
);

// later
hud.dispose();
monitor.dispose();
If you run your own loop, call monitor.begin() before the frame’s work and monitor.end() after
the render.
React Three Fiber
import { Canvas } from "@react-three/fiber";
import { PerfHud, PerfSampler } from "@zkmake/three-meter/react";

<>
  <Canvas>
    <PerfSampler />
    {/* scene */}
  </Canvas>
  <PerfHud />
</>;
PerfHud must sit outside <Canvas>, because Fiber treats HTML under it as three objects. The two
components find each other through a small shared store. A React context can’t do this, since the
Canvas is its own React root. To run two canvases on one page, pass the same store prop to both.
Options
mountPerfHud and PerfHud take:
| Option | Default | Meaning |
|---|---|---|
mode |
"compact" |
compact is the card. full is the checkbox list that configures it. |
theme |
"system" |
dark, light, or system to follow prefers-color-scheme live. A pick in the panel wins. |
defaultPlacement |
{ edge: "left" } |
First-visit dock, as edge plus align of start, center or end. A drag overrides it. |
storageKey |
three-meter |
localStorage key for the selection and the dock. null disables persistence. |
parent |
document.body |
Where the host element is appended. |
injectStyles |
true |
Append the stylesheet once per document. |
refreshHz |
10 |
Repaint rate. |
budgets |
timing defaults | Limits past which a value turns amber. See Budgets. |
label |
"Performance" |
Accessible name of the panel. |
PerformanceMonitor and PerfSampler take trackGPU (default true), gpuQueryPoolSize (default 5),
historySize (default 120) and frameStatsSize (default 1000).
Reading the panel
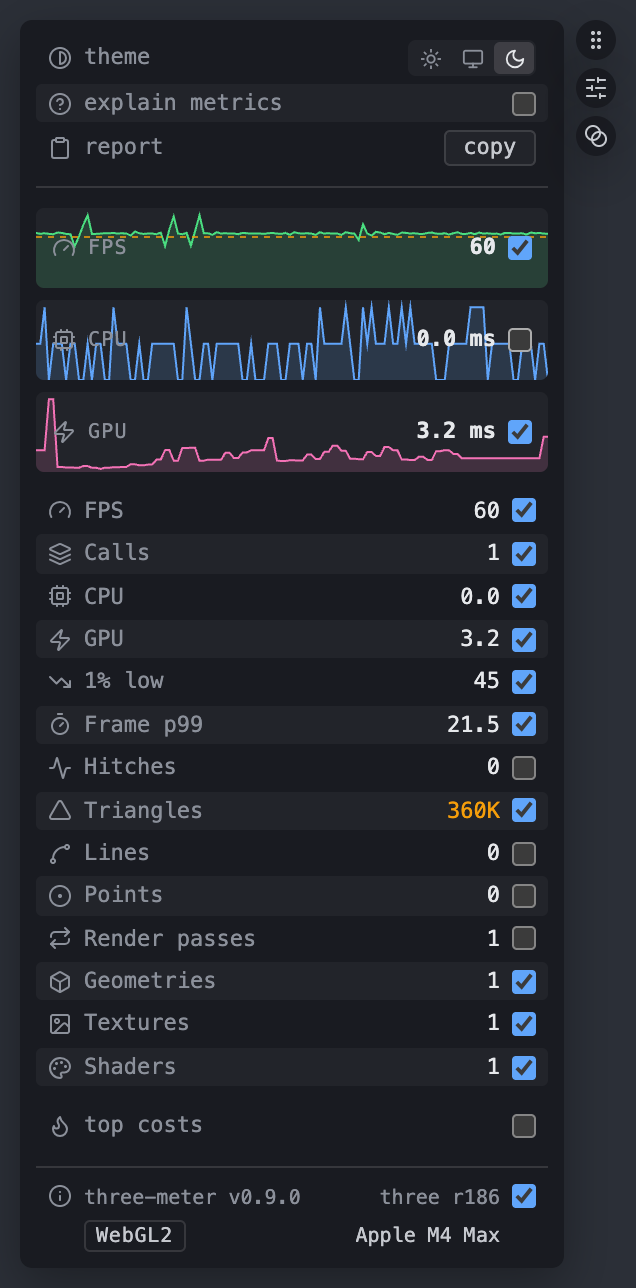
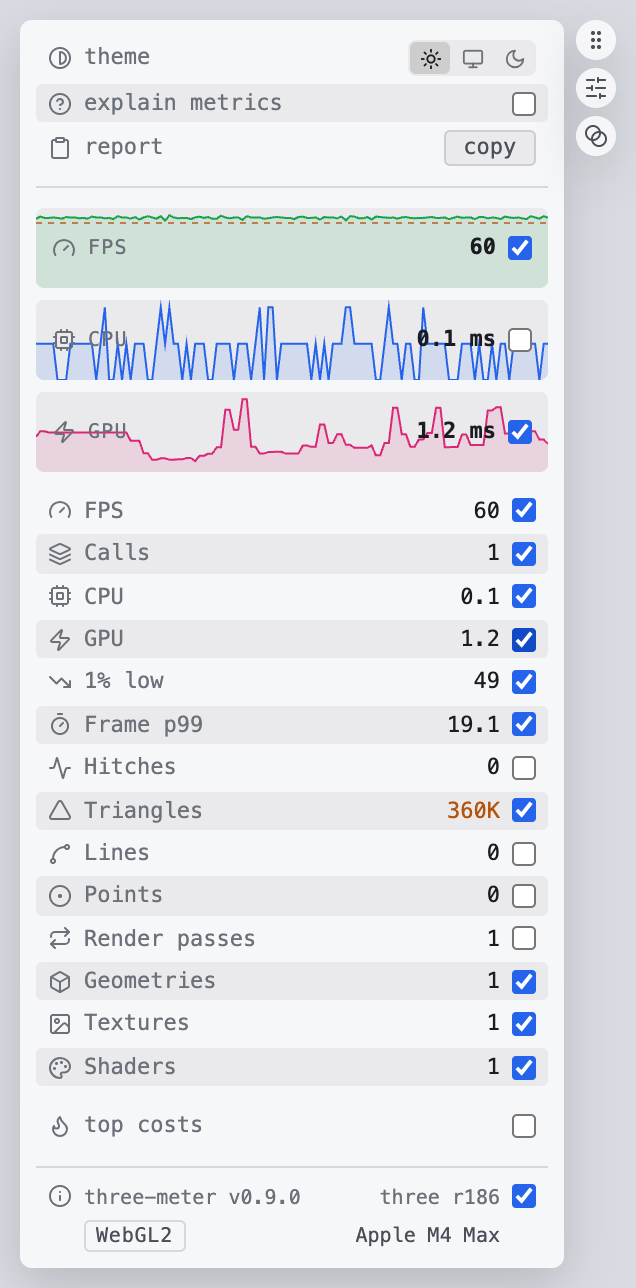
Every row has an icon, its value, and a checkbox on the right that puts it in the compact HUD. Hover a label for a one-line explanation of the metric and what a bad reading means, or tick explain metrics to show them all under the rows (also works on touch).
Stutter
Average FPS hides a hitch every few seconds. Three rows in the full view catch it, and any of them can be ticked into the compact HUD:
- 1% low: mean FPS across the slowest 1% of frames.
- Frame p99: 99% of frames finish within this many ms.
- Hitches: frames over twice the median frame time.
They cover the last frameStatsSize frames (1000 by default, about 16 s at 60 Hz). Gaps over a
second, like a hidden tab, are left out. Read them with monitor.getFrameStats():
monitor.getFrameStats();
// { frames: 1000, lowFps: 97.6, p99Ms: 10.2, hitches: 3, refreshHz: 120 }
Refresh rate and headroom
Refresh is the rate the loop runs at when it keeps up: the display’s refresh rate, or the app’s own cap if it throttles itself. It comes from the fastest tenth of recent frames, with each interval averaged against the next so a late frame and the early one after it don’t read as a faster display, then snapped to a common rate (60, 120, 144, …). It needs 60 frames.
Headroom is the spare time in each frame: the frame budget minus whichever of CPU and GPU took longer. At 120 Hz with 3 ms of GPU work that’s 5.3 ms. Below zero, frames miss the display’s refresh, and the row turns amber.
Budgets
A value past its budget turns amber in the full view and the compact HUD, and its tooltip names the budget. The FPS, CPU and GPU graphs draw the budget as a dashed line once the series reaches it; the scale never stretches to fit it, so a quiet graph keeps its detail.
Timing budgets come from targetFps: FPS at least 95% of it, 1% low at least half, CPU and GPU
within one frame, frame p99 within one and a half, headroom at least zero. Leave targetFps out and
they follow the detected refresh rate, so a 120 Hz display gets 8.3 ms budgets (60 until it’s
detected). Counts have no default, since what’s reasonable depends on the scene. Set your own:
mountPerfHud(monitor, { budgets: { targetFps: 120, calls: 500, triangles: 2_000_000 } });
hud.setBudgets({ gpu: null }); // null drops a default; false drops them all
PerfHud takes the same budgets prop and applies changes live.
Top costs
The HUD tells you there are 400 draw calls; top costs tells you which objects they come from. Tick it in the full view for the five biggest costs in the main render pass, grouped by meshes or materials, sorted by draw calls or triangles. Click a row’s name to log its three objects to the console.
                     calls   tris
tree ×300              300   9,600    ← 300 separate meshes: instance or merge them
house                    6      12    ← one draw per material in the array
dome                     2   7,936    ← transparent and double-sided draws twice
grass ×20,000            1  40,000    ← already instanced
Meshes with the same name and geometry share a row, so unmerged copies stand out. The numbers are
estimated from the scene graph the way three walks it: hidden objects, other layers and anything
outside the camera’s frustum are left out. Against three’s own renderer.info on a test scene they
matched exactly. Shadow maps and post-processing passes aren’t included; the main pass is the render
call that drew the most, so a full-screen quad rendered last doesn’t stand in for the scene. It
walks the scene only while open, twice a second.
monitor.getSceneCost();
// { calls: 309, triangles: 57548, meshes: [{ key: "mesh:tree…", label: "tree", calls: 300, … }, …], materials: […] }
Test a cost by hiding it
Calls and triangles aren’t time. The eye on each row hides its objects, every copy in the scene
including ones off screen, and the row then shows what that saved: GPU time averaged over 30 frames
before and after hiding (CPU time where there’s no GPU timer), like −4.3 ms GPU. Hidden rows stay
listed so you can show them again. Everything comes back when you untick top costs or the HUD is
disposed, and objects that were already invisible stay that way. monitor.getObjectsForKey(key)
returns the same objects for a row’s key.
Bug reports
The report row’s copy button puts a Markdown snapshot on the clipboard: versions, backend, GPU,
the current metrics, the stutter stats, the top three meshes, the viewport and the user agent. Paste it into an issue.
formatReport(monitor) from @zkmake/three-meter/ui returns the same text.
three-meter v0.10.0 · three r186 · WebGL2 · Apple M4 Max
FPS 120 · 1% low 98 · p99 10.2 ms · hitches 3 / 1,000 frames
CPU 0.2 ms · GPU 0.7 ms · refresh 120 Hz · headroom 7.6 ms
Calls 1 · passes 1 · triangles 24,000 · lines 0 · points 0
Geometries 1 · textures 1 · shaders 1
Top: tree ×300 (300 calls, 9,600 tris) · house (6 calls, 12 tris) · dome (2 calls, 7,936 tris)
Viewport 1280×720 @2x
Mozilla/5.0 (Macintosh; Intel Mac OS X 10_15_7) …
Environment
The full view’s footer has two rows: the three-meter version (linked to its release notes) and the
three revision, then the backend and the GPU name. An amber WebGL2 fallback badge means
WebGPURenderer couldn’t get WebGPU. Its checkbox (off by default) shows the footer in the compact
HUD too. The same data is on the monitor:
monitor.getEnvironment();
// { three: "186", backend: "webgpu", fallback: false, gpu: "Apple metal-3" }
backend is null until WebGPURenderer.init() settles. gpu comes from WebGPU’s adapter info or
WebGL’s unmasked renderer string, and is null where the browser hides it. Chrome’s WebGPU gives
vendor and architecture, not the model.
GPU timing
On WebGL2 the monitor uses EXT_disjoint_timer_query_webgl2, which Chrome and Edge expose. Safari
and Firefox don’t, so the GPU row shows — and sample.gpu.available is false.
On WebGPU, construct the renderer with trackTimestamp: true. Timings resolve a frame or two late.
Theme
The HUD ships a dark and a light palette. Two layers decide which shows:
- The panel’s own pick. The full view has a light / system / dark row. A pick there is kept
with the other settings under
storageKeyand wins while set. - Your
themeoption.dark,light, orsystem(the default), which follows the OS and switches when it does. Applies whenever the person using the HUD hasn’t picked anything.
Change your layer later from the handle, or from the PerfHud prop in React, which applies without
remounting:
const hud = mountPerfHud(monitor, { theme: "system" });
hud.setTheme("light"); // your layer: "dark" | "light" | "system"
hud.getTheme(); // your layer, as asked for
hud.settings.theme; // the panel's pick, or null
hud.settings.setTheme(null); // clear the pick so your layer applies again
hud.theme.effective; // whichever layer is in force
hud.theme.resolved; // "dark" | "light", what is on screen right now
hud.theme.subscribe(() => syncMyPageWith(hud.theme.resolved));
The resolved theme lands on data-theme of .perf-hud and .perf-monitor. To restyle either
palette, override the --perf-* custom properties (bg, fg, fg-dim, muted, row,
border, accent, warn, shadow) on those selectors. warn is the over-budget amber.
The dev-panel frame
The HUD’s frame is mountDevPanel from @zkmake/three-meter/ui: the docked host, a card with a
brand label on top, and the drag / expand-compact / dim-on-leave discs. Other zkmake dev panels
(@zkmake/three-textures) mount through it too, so they all dock, wake, dim and theme the same way.
A tool of your own can use it:
const panel = mountDevPanel({
  brand: "my-tool",
  label: "My tool",
  content: myElement,
  theme: new HudTheme("system"),
  storageKey: "my-tool",
  onToggle: () => myElement.classList.toggle("is-compact"),
});

panel.detail.textContent = "3 items"; // the brand row's right-hand slot
The card is .perf-hud__card, holding .perf-hud__brand and your content (the HUD’s is
.perf-monitor).
Examples
apps/site/src/demos/three-meter is what runs at three-kit.pages.dev/three-meter:
both integrations of the same scene, swapped from the header.
vanilla.ts is plain three with mountPerfHud;
r3f.tsx is React Three Fiber with PerfSampler and
PerfHud. Both set a 250K triangle budget on top of the timing defaults. ?r3f opens on Fiber,
?webgpu uses WebGPURenderer in either, ?count= scales the scene. The header’s theme toggle sets the page theme and the HUD’s theme layer together; the row
inside the panel overrides the HUD alone. Run bun run dev in apps/site after a bun install at the repo root.
Shipping it
Styles inject at runtime by default. To link them instead, pass injectStyles: false and import
@zkmake/three-meter/styles.css.
The package never reads NODE_ENV or import.meta.env. Whether the HUD exists in production is
your call. Gate the import in the app with a ?debug= query, a build flag or a dynamic import().
Contract
While a monitor is attached, renderer.info.autoReset is off and begin() resets info. One
monitor per renderer. A second throws. dispose() restores everything. Theme with the --perf-*
custom properties on .perf-hud and .perf-monitor, or the theme option.
Contributing
See CONTRIBUTING.md. Changes ship with a changeset.
License
MIT